How to Get Started with Power BI
On today’s Tech Talk, we’ll be discussing business intelligence (or BI for short), which is a process for discovering trends or patterns in your data and then presenting them in a visually-engaging way. Seeing your data fully visualized helps you understand what’s happening across your organization and helps informs your decision-making.
Implementing BI used to be a heavy lift, but tools like Microsoft’s Power BI have done away with the need for expert coding skills, and the process is now a lot simpler than most expect. Here’s how you can get started with Power BI in 5 simple steps:
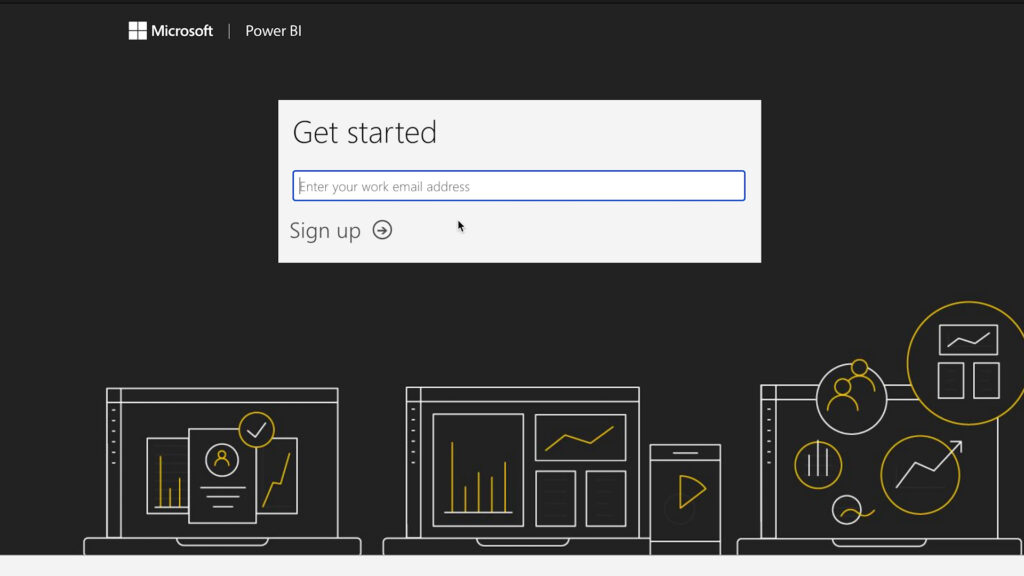
#1 Download and Install Power BI
Power BI has a free version that you can easily download and start using. Be mindful that Power BI Pro licenses are included with a Microsoft 365 E5 or Ofice 365 E5 subscription, so may already have access through these plans.
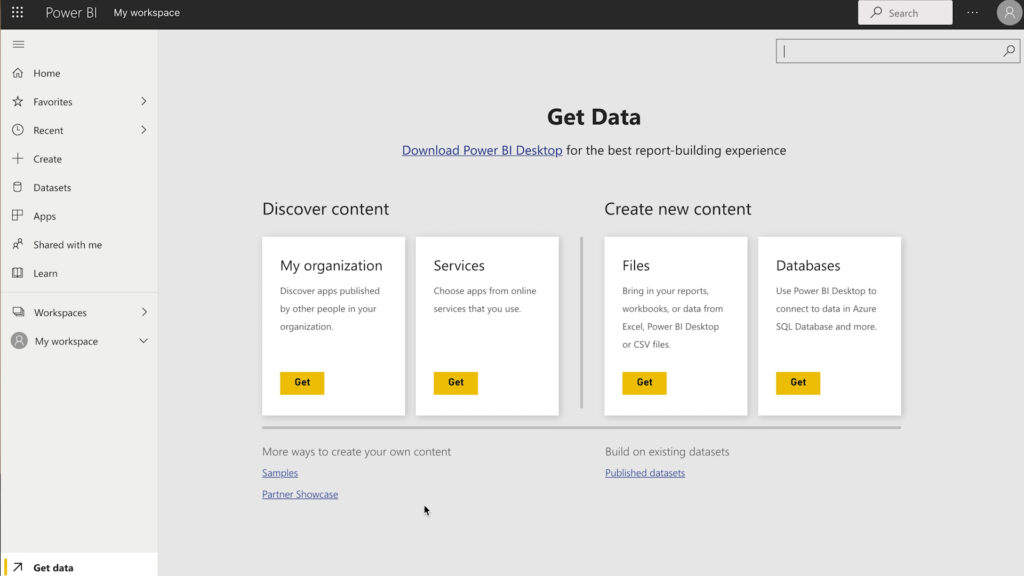
#2 Data Sources
BI’s results will only be as good as the data you import, so ensure that your data is organized. With Power BI open, click on Get Data to start importing a data source. BI is flexible, allowing you to import data from multiple sources.
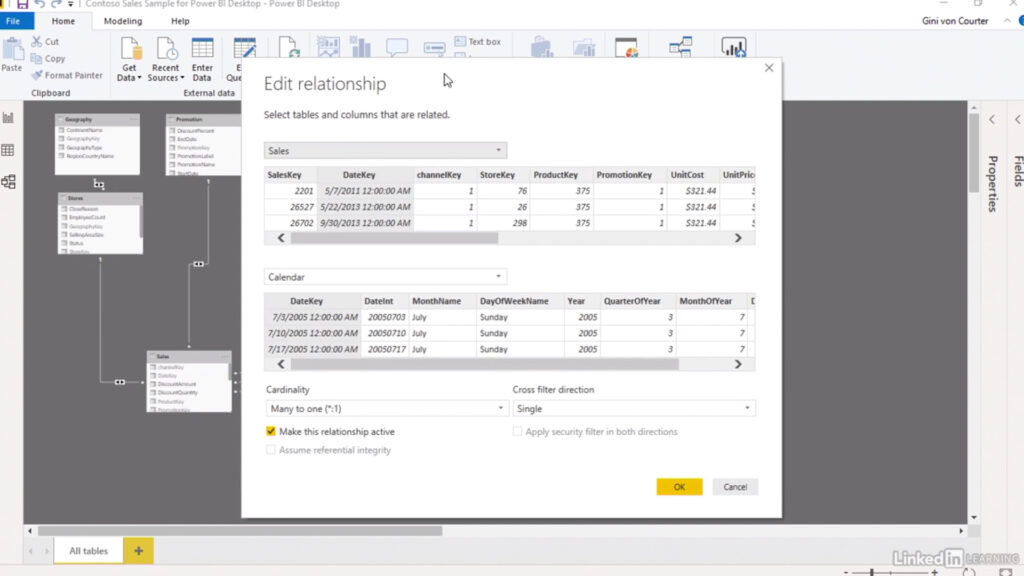
#3 Model Your Data
At this stage, you can begin building relationships between your data. Power BU allows you to drag and drop columns between tables and perform analytics with the data you’ve imported.
#4 Build Your Reports
Now, you can begin to create visualizations that present your data in an organized and fun way. Utilizing a menu of templates, you can drag and drop data to be presented in the way you wish.
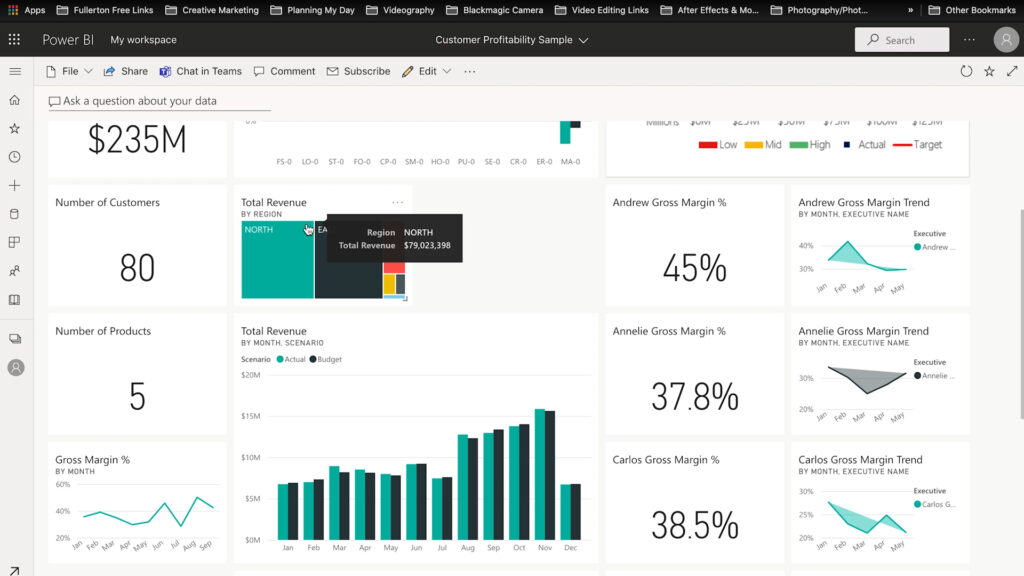
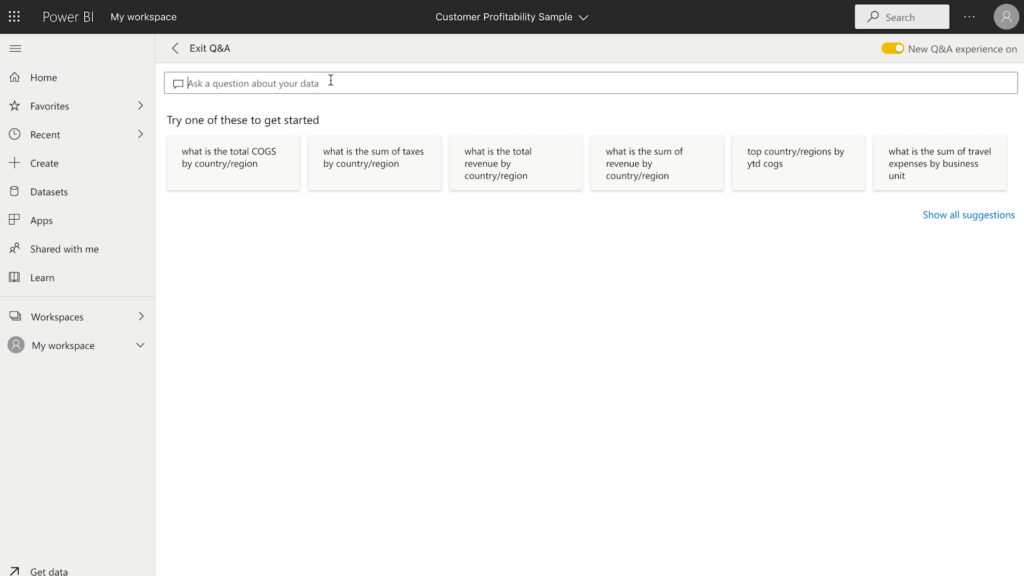
#5 Ask Questions of Your Data
Power BI gives you the ability to ask questions of your data by typing into a query, similar to a Google search. It’s a great feature that uses machine learning and natural-language processing to navigate through your data and stay informed.
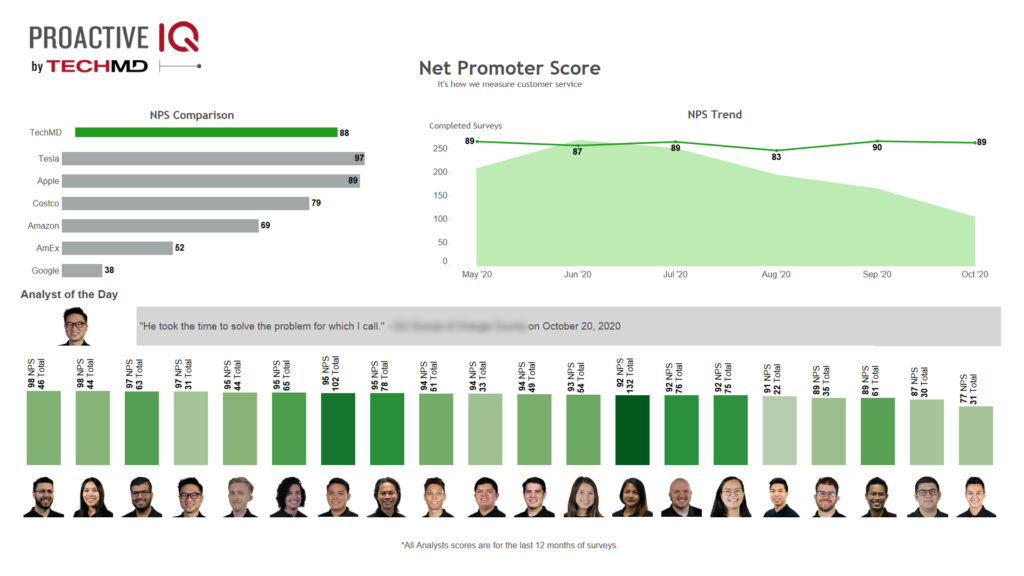
Power BI is essential to how TechMD functions every day. Here are a few examples of how we use data to provide the best IT experience possible:
SLA Dashboard:

Customer Satisfaction Dashboard:
Hopefully now you have a better idea of what business intelligence is capable of, why your organization might want to use it, and how to get started with Power BI. You can find several resources for further learning about Power BI below. If you have any questions, don’t hesitate to reach out to us!
Further Resources
- Microsoft Power BI (Official YouTube)
- Power BI Tips (YouTube)
- Power BI Training & Certification (Learning Tree)
- Power BI Tutorials (Lynda)
About TechMD
TechMD is an award-winning IT services firm that specializes in managed IT services in Orange County and Los Angeles, managed cybersecurity, cloud solutions, and strategic IT consulting. We are passionate about bringing enterprise-level productivity, scalability, and security to small and medium businesses.